Investors are familiar with the boom in commodity prices and experience the effects of rising prices for those they use, petrol being the most obvious. Australian investors are "enjoying" the fruits of the boom through the high inflows of capital into our economy, and at the same time suffering under the high interest rates the inflation-fighting Reserve Bank of Australia is imposing in response.
So investing in commodities should be a way to generate returns as well as a hedge to protect your investments against the rising costs flowing from the boom. Because Australia is apparently in a long-term commodities "supercycle" - linked to the urbanisation and industrialisation of China, India and other emerging economies - we ought to be thinking that investing in commodities is important now and for the future.
It is not that simple. Post-GFC investor scepticism combined with the "black box" of commodity prices - how much of the price is driven by hedge fund speculation and hoarding? - has traditionally forced most investors to stay away from commodities as an asset class.
This article provides a balanced analysis of the pros and cons of agricultural commodity investing and how to include it in portfolios, with guidance on how to interpret and react to the "noise" surrounding commodities. There has been a huge shift in the production and consumption of most commodities, with agricultural (soft) commodities subject to the same explosive demand growth that is driving prices for hard commodities.
Portfolio efficiency can be improved by including 5-10 per cent agricultural commodity exposure by, for example, using the BetaShares ETF (ASX code: QAG).
Commodity boom sustainability
Commentators say the current commodity boom is driven by the growth and industrialisation in emerging economies, which overlays the normal demand from developed economies. This typically leads to research by brokers and investment managers that encourages investors to buy resource-related shares and also invest in the underlying commodities. In parallel, we also hear claims that the China story is a bubble waiting to burst and that economic growth in emerging markets is likewise uncertain.
With a heavy dose of scepticism in mind, let's look at the evidence of how real this commodities boom is, what are the enduring sources of high prices, and what are the risks for investors. We will see that the drivers of demand for the soft agricultural commodities (wheat, rice, corn, etc) are very similar to those of hard commodities (iron ore, coal, copper, etc).
The Reserve Bank of Australia is one of the most consistently accurate economic forecasters available to us. In November 2010 its governor, Glenn Stevens, highlighted how much stronger the commodities boom was than any of its predecessors.
Australian Terms of Trade

Source: RBA
Stevens noted that commodity prices have always experienced a "boom and bust" cycle in Australia, going so far as to say the RBA assumes that iron ore prices will moderate over coming years as supply increases to match demand. Yet he was clear that there was a reasonable basis for the view that the boom may be "longer and stronger" than previous ones.
The chart above, which Stevens used in his speech to the Committee for Economic Development of Australia (CEDA), makes it clear that, despite the various booms during the 19th and 20th centuries, the long-term trend in commodity prices was downward for all of the 20th century. This leads many commodity sceptics to predict the current boom may just be a blip in demand, and therefore commodity investing will end in tears.
A great source of analysis comes from the eminent investor Jeremy Grantham, founder of investment house GMO. As a noted sceptic of broker and investment bank claims about rising asset prices, his detailed analysis of the "paradigm shift" in commodity prices is a must read for all investors. This is what he says about the current commodity boom:
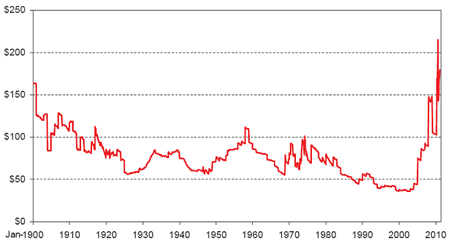
"…we now live in a different, more constrained, world in which prices of raw materials will rise and shortages will be common…accelerated demand from developing countries, especially China, has caused an unprecedented shift in the price structure of resources. After 100 years or more of price declines, they are now rising and in the last eight years have undone, remarkably, the effects of the 100-year price decline."
Grantham names the Chinese industrial revolution, which grew exponentially after China joined the World Trade Organisation in 2001, as the primary source of the "great paradigm shift" in commodity prices.
The table below shows how extensive Chinese demand is for commodities.
So investing in commodities should be a way to generate returns as well as a hedge to protect your investments against the rising costs flowing from the boom. Because Australia is apparently in a long-term commodities "supercycle" - linked to the urbanisation and industrialisation of China, India and other emerging economies - we ought to be thinking that investing in commodities is important now and for the future.
It is not that simple. Post-GFC investor scepticism combined with the "black box" of commodity prices - how much of the price is driven by hedge fund speculation and hoarding? - has traditionally forced most investors to stay away from commodities as an asset class.
This article provides a balanced analysis of the pros and cons of agricultural commodity investing and how to include it in portfolios, with guidance on how to interpret and react to the "noise" surrounding commodities. There has been a huge shift in the production and consumption of most commodities, with agricultural (soft) commodities subject to the same explosive demand growth that is driving prices for hard commodities.
Portfolio efficiency can be improved by including 5-10 per cent agricultural commodity exposure by, for example, using the BetaShares ETF (ASX code: QAG).
Commodity boom sustainability
Commentators say the current commodity boom is driven by the growth and industrialisation in emerging economies, which overlays the normal demand from developed economies. This typically leads to research by brokers and investment managers that encourages investors to buy resource-related shares and also invest in the underlying commodities. In parallel, we also hear claims that the China story is a bubble waiting to burst and that economic growth in emerging markets is likewise uncertain.
With a heavy dose of scepticism in mind, let's look at the evidence of how real this commodities boom is, what are the enduring sources of high prices, and what are the risks for investors. We will see that the drivers of demand for the soft agricultural commodities (wheat, rice, corn, etc) are very similar to those of hard commodities (iron ore, coal, copper, etc).
The Reserve Bank of Australia is one of the most consistently accurate economic forecasters available to us. In November 2010 its governor, Glenn Stevens, highlighted how much stronger the commodities boom was than any of its predecessors.
Australian Terms of Trade

Source: RBA
Stevens noted that commodity prices have always experienced a "boom and bust" cycle in Australia, going so far as to say the RBA assumes that iron ore prices will moderate over coming years as supply increases to match demand. Yet he was clear that there was a reasonable basis for the view that the boom may be "longer and stronger" than previous ones.
The chart above, which Stevens used in his speech to the Committee for Economic Development of Australia (CEDA), makes it clear that, despite the various booms during the 19th and 20th centuries, the long-term trend in commodity prices was downward for all of the 20th century. This leads many commodity sceptics to predict the current boom may just be a blip in demand, and therefore commodity investing will end in tears.
A great source of analysis comes from the eminent investor Jeremy Grantham, founder of investment house GMO. As a noted sceptic of broker and investment bank claims about rising asset prices, his detailed analysis of the "paradigm shift" in commodity prices is a must read for all investors. This is what he says about the current commodity boom:
"…we now live in a different, more constrained, world in which prices of raw materials will rise and shortages will be common…accelerated demand from developing countries, especially China, has caused an unprecedented shift in the price structure of resources. After 100 years or more of price declines, they are now rising and in the last eight years have undone, remarkably, the effects of the 100-year price decline."
Grantham names the Chinese industrial revolution, which grew exponentially after China joined the World Trade Organisation in 2001, as the primary source of the "great paradigm shift" in commodity prices.
The table below shows how extensive Chinese demand is for commodities.


0 comments